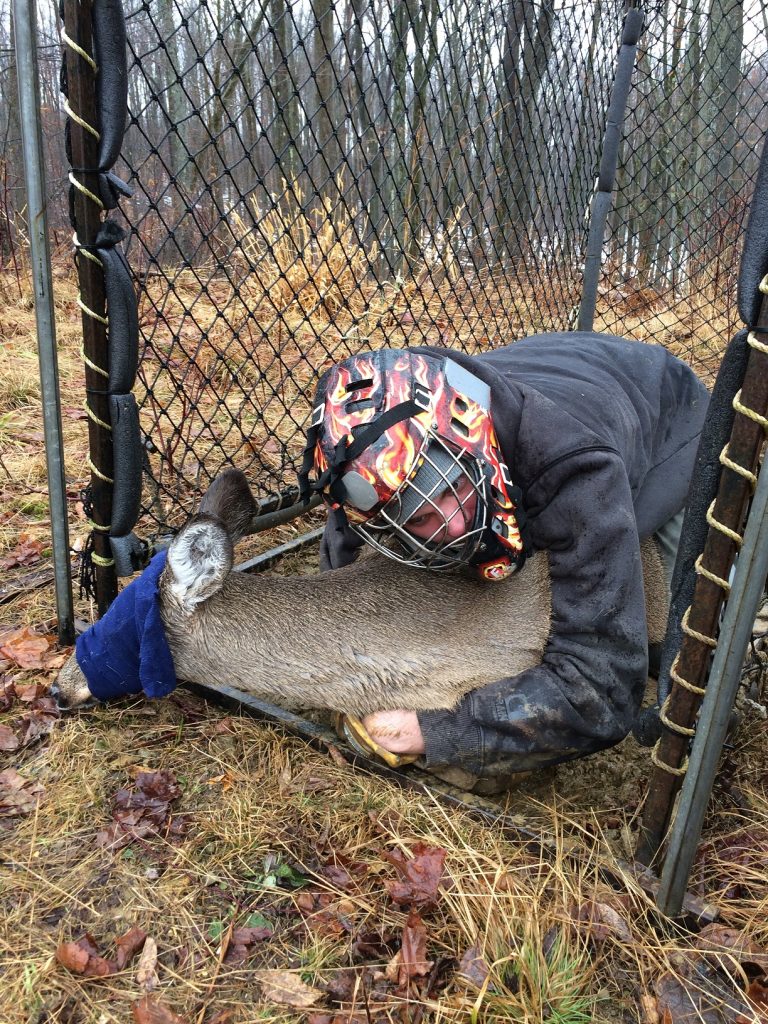
This is the 5th year we’ve captured deer as part of The Deer-Forest Study. This year was a tough year to trap deer with all the warm weather and bears.
Ideal trapping weather is temperatures in the 20s and 30s with about 6” of snow. These conditions make deer hungry (and less wary of traps and rocket nets) and hide acorns, but don’t make travel difficult (for deer or trapping crews).
Really cold weather doesn’t hurt, but it is tough on field technicians!
Despite the poor trapping conditions this year, the crew on the Susquehannock greatly exceeded captures from past years and the southern crew had a very respectable year as well.
Captures on Northern Study Areas
| Year | Adult F | Adult M | Subadult F | Subadult M | Total |
|---|---|---|---|---|---|
| 2013 | 25 | 18 | 6 | 3 | 52 |
| 2014 | 9 | 13 | 5 | 10 | 37 |
| 2015 | 18 | 10 | 9 | 6 | 43 |
| 2016 | 19 | 16 | 9 | 11 | 55 |
| 2017 | 27 | 24 | 15 | 15 | 81 |
*Subadults were 8-11 months old and adults were >1.5 years old
Captures on Southern Study Areas
| Year | Adult F | Adult M | Subadult F | Subadult M | Total |
|---|---|---|---|---|---|
| 2013 | 17 | 9 | 6 | 7 | 39 |
| 2014 | 14 | 12 | 8 | 8 | 42 |
| 2015 | 6 | 5 | 2 | 3 | 16 |
| 2016 | 10 | 8 | 8 | 13 | 39 |
| 2017 | 14 | 8 | 6 | 9 | 37 |
Trapping data can provide some insights into what’s going on with the deer population. However, the results need to be taken with a grain of salt because different sex-age classes of deer have different probabilities of being captured. For example, the older the deer the more difficult they are to capture.
Capture numbers may be clouded by capture probability, but relationships can still sometimes be observed. Like when we captured male deer to study the effect of antler point restrictions (APRs) back in 2002-2005.
The subadult:adult capture ratio declined from 10:1 in 2002 (before APRs) to 2:1 by 2004.
Males captured during 2002-2004
| Year | Subadults* | Adults* | Subadult:Adult |
|---|---|---|---|
| 2002 | 117 | 12 | 9.7:1 |
| 2003 | 177 | 20 | 8.9:1 |
| 2004 | 148 | 70 | 2.1:1 |
*Subadults were 8-11 months old and adults were >1.5 years old
Those changes in trapping success back in 2002-2005 reflected changes in the age structure of the population. We know this because we monitored harvest and survival rates. Harvest rates declined and survival increased during that time period that increased the proportion of older bucks in the population.
What about the current study?
The ratio of subadult:adult males has averaged 1:2 in the northern study areas and 1:1 in the southern study areas. Equal numbers of adult and subadult males in the population? Or maybe even more adults than subadults?
Sound crazy?

Not really. We recently reported that harvest rates on our current study areas are some of the lowest we’ve ever recorded for Pennsylvania deer research. Those low harvest rates mean that there are more, older bucks on these state forests.
The adult female:adult male capture rates have averaged 1.2:1 in the north and 1.5:1 in the south. This is to be expected because of the low harvest rates for bucks. Statewide the adult female:adult male ratio averages 2:1 across all management units.
Finally, notice that the subadult male:subadult female capture ratio averaged about 1:1 in the north and 0.8:1 in the south. Again, this is to be expected as survival for males and females is about equal in the first year of life.
Clouded or not, it appears our trapping efforts are a reflection of what we know about the deer population dynamics on our study areas. Which is kind of nice.
-Duane Diefenbach
If you would like to receive email alerts of new blog posts, subscribe here.
And Follow us on Twitter @WTDresearch
