Well, have you heard the joke about the forester, wildlife biologist, and statistician that went hunting?
The statistician had never been deer hunting so his friends took him out on opening day. They got up early and sat for a couple of hours. Not seeing anything they got up and began still hunting (after explaining to the statistician it didn’t involve being still). After just a few hundred yards they saw a really nice 8-point buck. The wildlife biologist raised his rifle, fired, and the bullet went 2 feet to the right of the deer. Unbelievably, the deer didn’t move!Snickering under his breath, the forester pulled up with his rifle and shot 2 feet to the left of the deer! The statistician was quiet for a few seconds, but suddenly became very excited and exclaimed, “We got him!”
Clearly, the average (dead center) was not of much use in harvesting that buck.
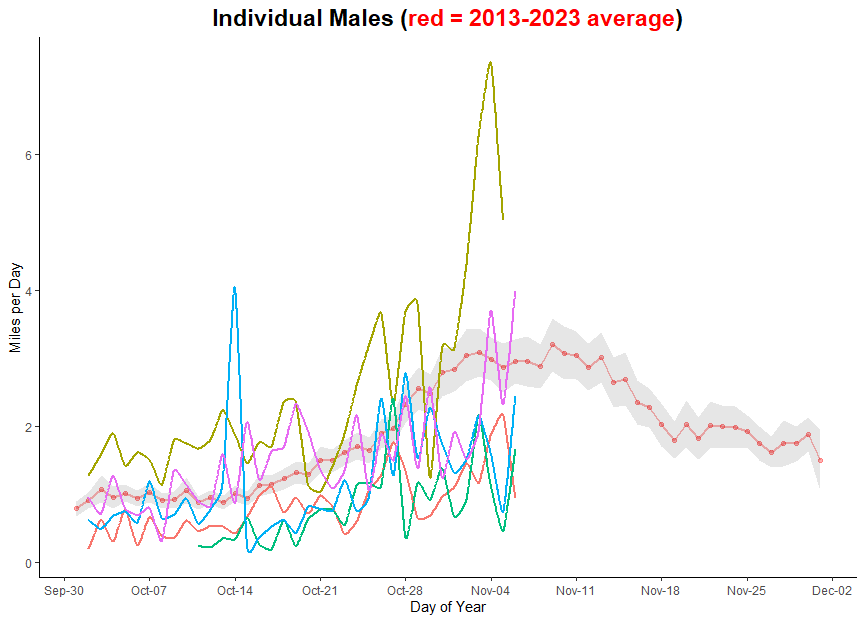
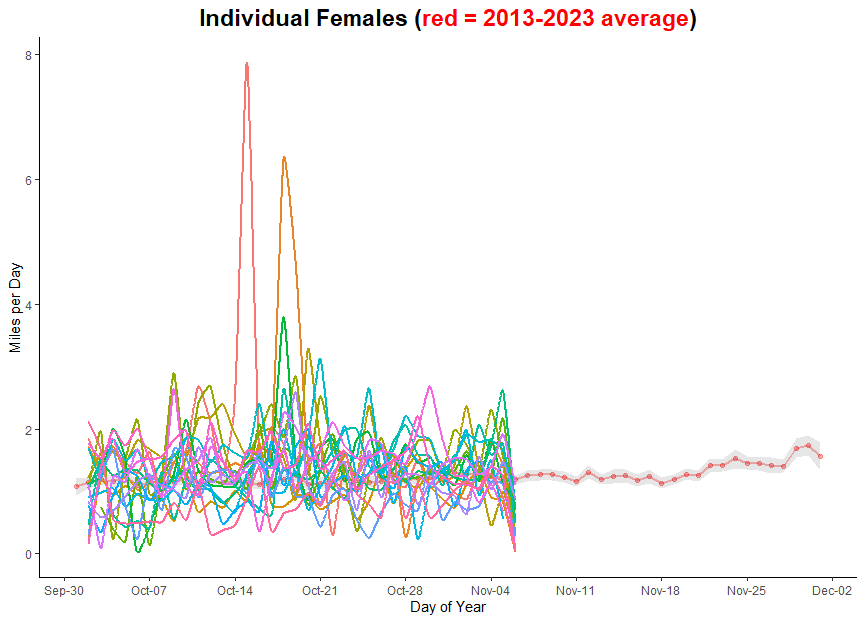
Over the past few weeks, we’ve been showing you the average daily distance traveled by our deer. Today we’re going to show you how much variability there is around that mean distance traveled.
First, the males. You can see there appears to be a general increase in movements, but one of the most active days was for a buck in the middle of October and another within the past week.

Females are even more interesting. On two different days in mid-October two females traveled over 6 miles. At first, I thought this might be just a GPS error (sometimes satellite fixes are not that accurate), but this was not an anomalous reading from the satellite but a real movement. We have had other deer make these types of moves. Regardless, there is no evidence of any trend in this year’s female movements, as expected from the 11-year average.

The latest data from our deer have been uploaded to our Rut Tracker page. Check it out (and if the page doesn’t look updated try clicking the ‘refresh’ button on your web browser).
