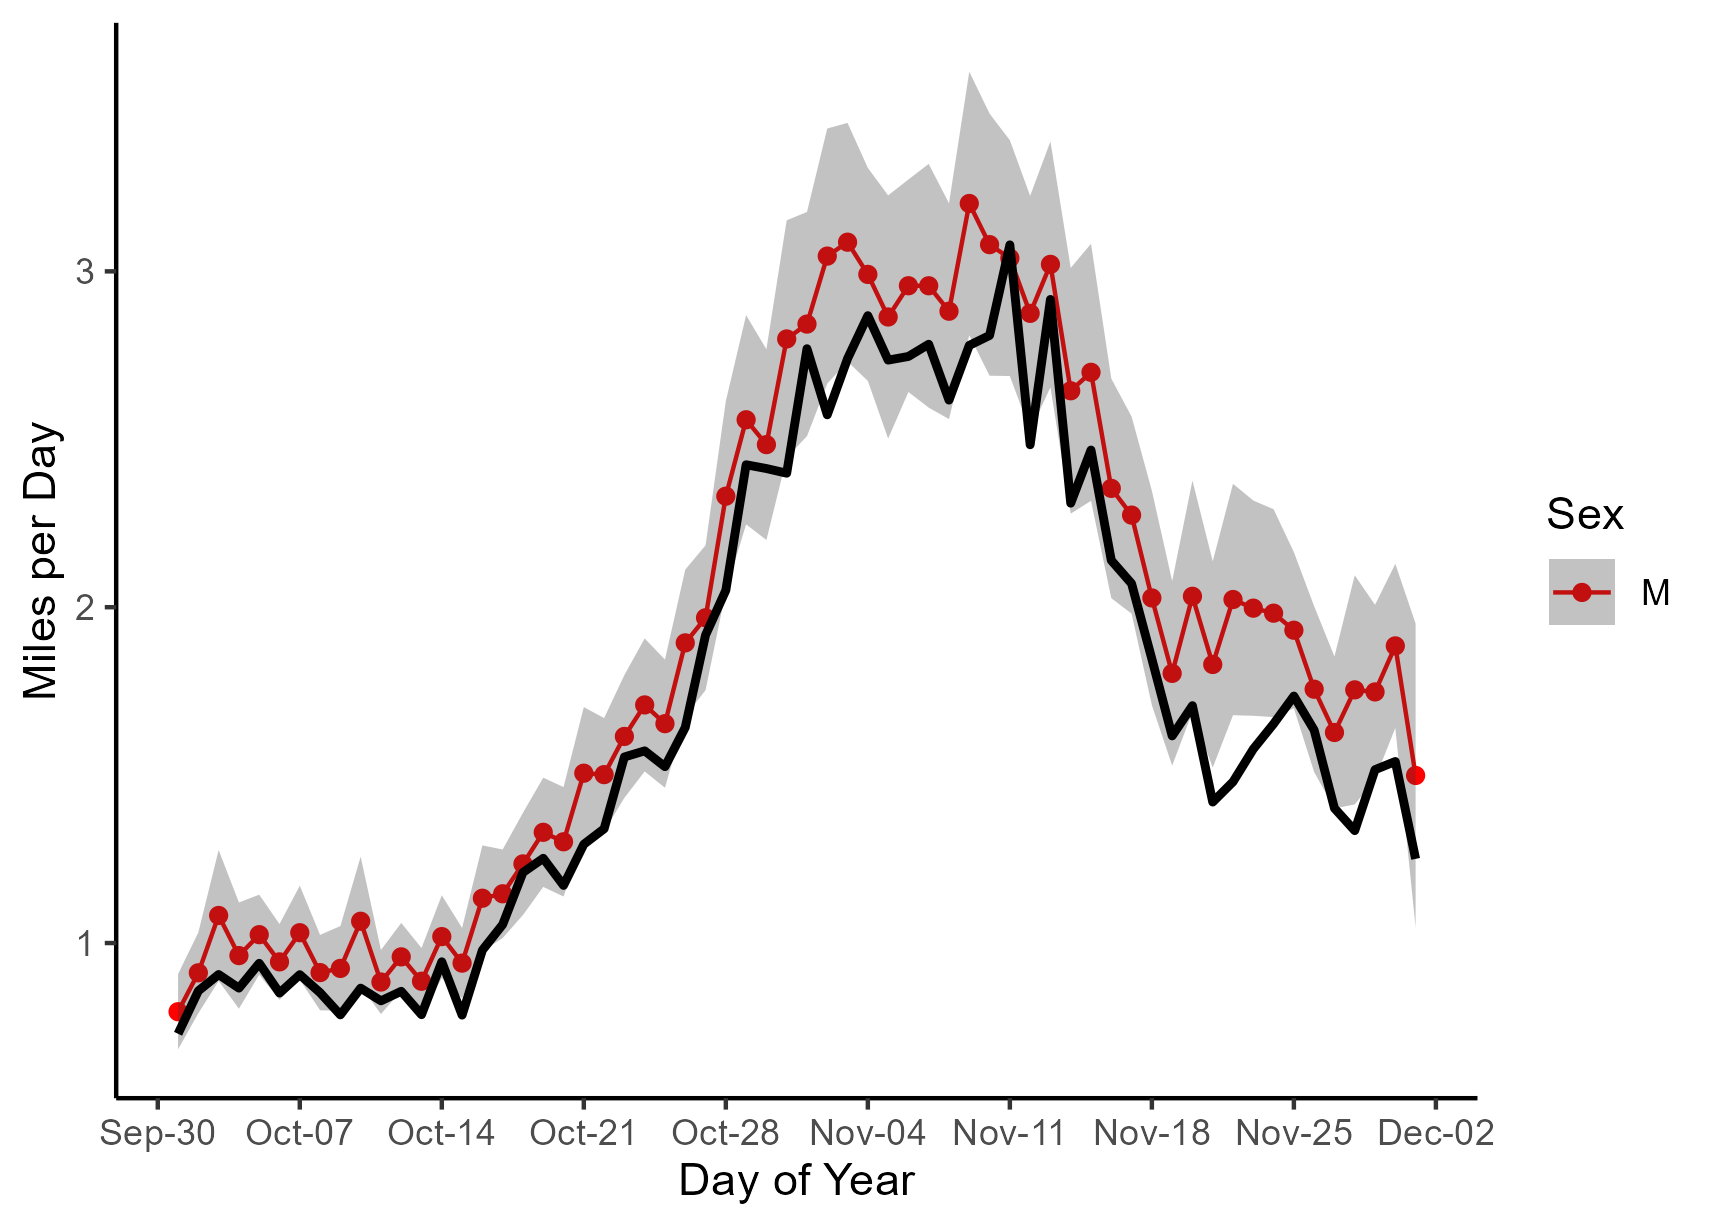
Last week Shane asked how different a graph of median movements might be compared to the mean. A great question and one that I will answer today. But first, we will make a prediction.
The median is the value where 50% of data points have larger values and 50% of the data points have smaller values. It’s often used when we talk about housing prices because a few million-dollar mansions can make the mean really large, even if many houses are just cottages. The same goes for deer movements – deer can’t move less than 0 miles per day, but some individuals might go 4, 5, or even 6 miles.
So the prediction? The median miles traveled per day will be less than the mean.
And that is the case for males. The black line is the median value and the red line is the mean. But median distance traveled is still almost 3 miles per day at the peak of the rut.

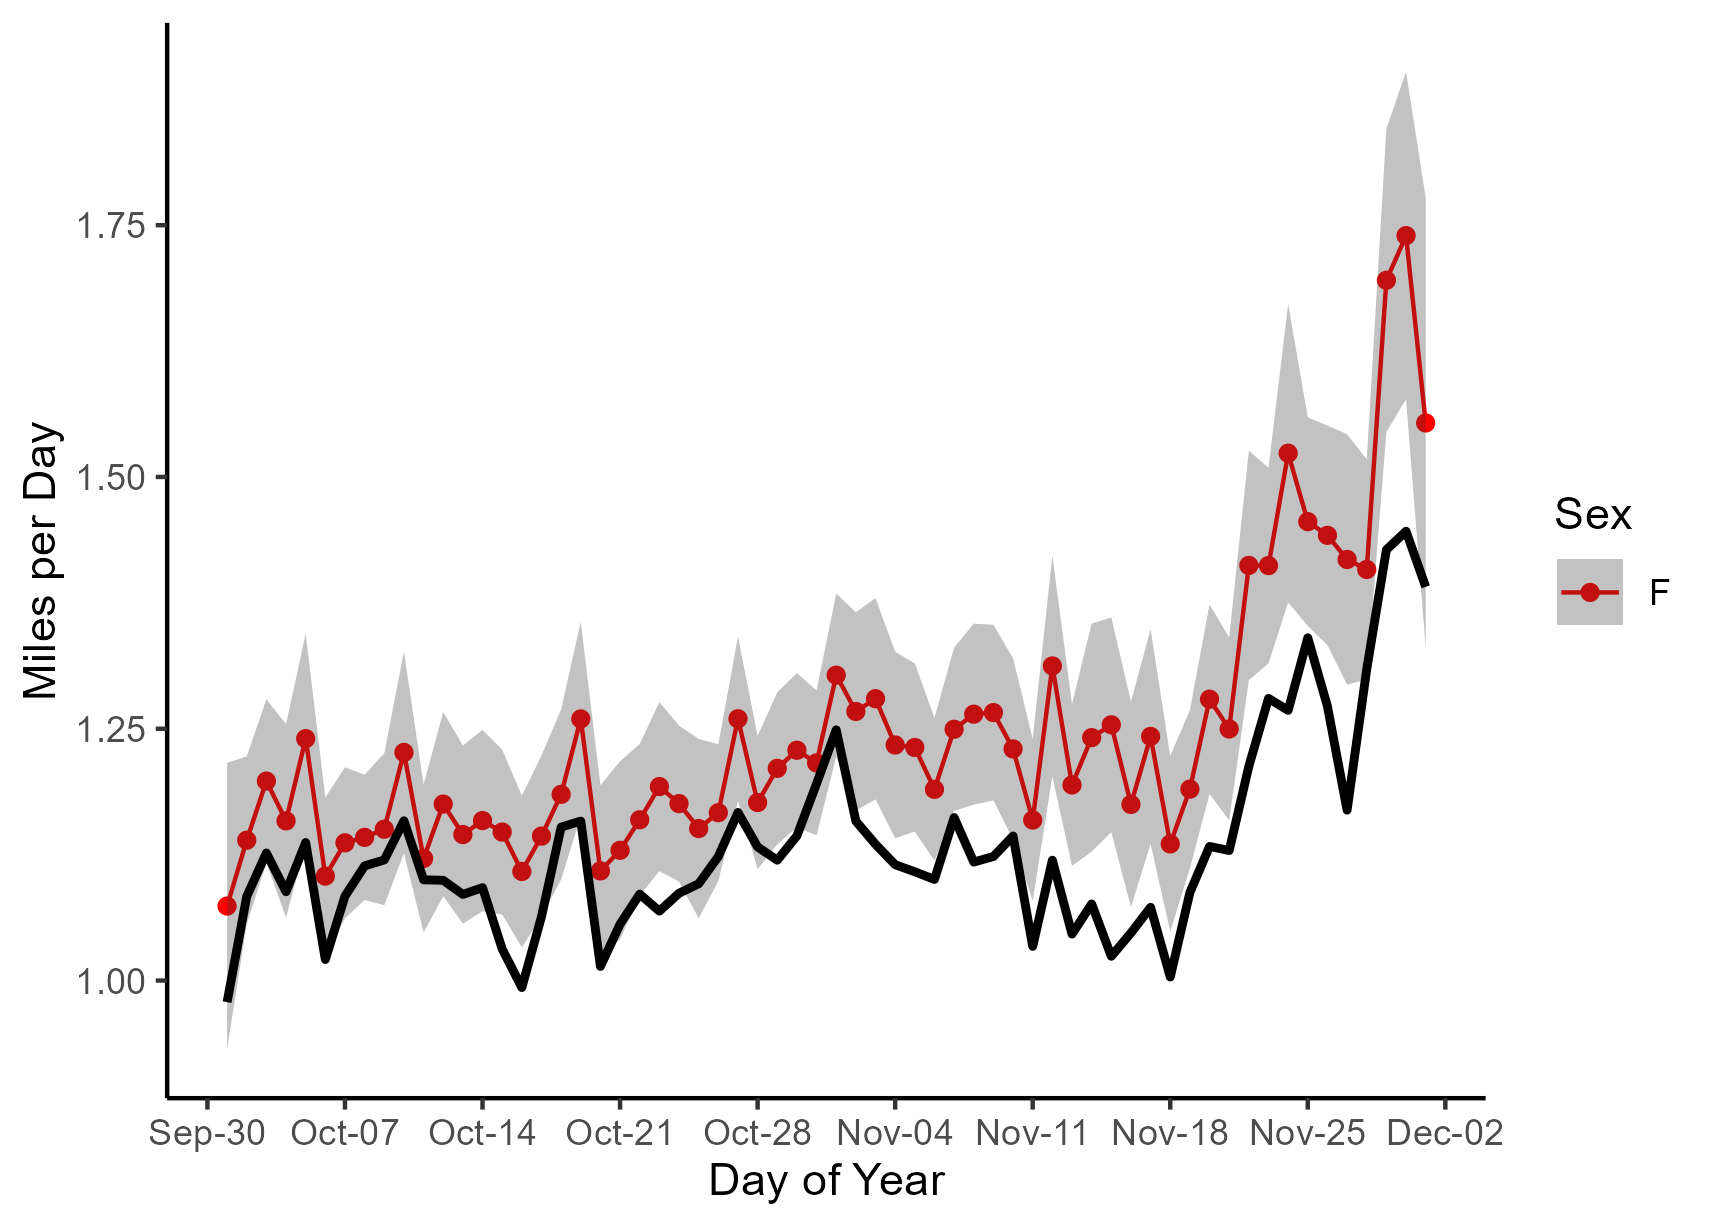
For females it’s similar.

Yesterday I watched a red fox mousing in the field – it got a vole (I could tell because he was digging after he pounced and came up with a bite-sized morsel). It’s awesome watching them crouch, leap 2 feet in the air, and land on their quarry 4 feet away! We finally got some rain Sunday night and cooler temperatures today.
The latest data from our deer have been uploaded to our Rut Tracker page. Check it out (and if the page doesn’t look updated try clicking the ‘refresh’ button on your web browser).
